
Optimizing the formulation of reagents for your qPCR assay requires careful experimental design that looks across several performance factors for each reagent formulation tested. These performance factors include assay specificity, reliability, repeatability, linearity, sensitivity and efficiency.
For each amplification formulation tested, start with an Analysis of qPCR Amplification Data Quality:
- Ensure that no amplification is observed in no-template control (NTC) reactions. Check that NTC reactions have no Cq value determined. Otherwise, very high Cq values (>38 cycles) may be acceptable, as long as they are not within 3 cycles of the reactions containing your lowest template concentrations.
- Use automatic baseline and threshold settings.
- Confirm that the appropriate baseline window is set for data. On a linear plot of fluorescence signal versus cycle number, confirm that the baseline signal looks flat within the window defined by the analysis software.
- Confirm that the appropriate threshold is determined for the data. The line defining the threshold must fall within the exponential phase of amplification across all reactions for a specific assay. On the semi-log plot of (log(fluorescence signal) vs. cycle number), the threshold should cross the portion of each amplification curve that appears straight.
Determining Which qPCR Reagent Formulation Works Best
Once you have confirmed the quality of the amplification data, you can look at the performance factors of the qPCR master mix and primer/probe combinations tested.
- Reaction specificity. If using a qPCR master mix with dsDNA binding dye, a single peak in the melt curve analysis indicates specificity. For probe-based detection of amplification, the probe should impart specificity for the amplicon of interest. NTC reactions should show no amplification, late amplification or primer artifact (low Tm) amplification only.
- Assay repeatability. Repeatability can be assessed from the standard deviation around the Cq for technical replicates. ±0.5 Cq is a reasonable cutoff for high standard deviation. A data point should be excluded if the standard deviation of Cq > 0.5.
- Assay linearity. The coefficient of determination, r2, for the fit of the linear regression equation fitted to the semi-log plot, Cq vs. log(input concentration), should be >0.98. Points at the extreme ends of the concentration range that throw off the fit of the linear regression equation (r2 < 0.98 if point is included) are excluded as outside the linear range of the assay.
- Assay sensitivity. The sensitivity is the lowest template concentration at which a Cq can be reliably determined. Information about the assay sensitivity can be inferred from the lowest data point included in the standard curve with a good fit of the linear regression equation.
- Reaction efficiency. Efficiency for the qPCR assay can be determined from the slope of the linear regression line according to the following equation and is automatically calculated in most software: Efficiency = –1 + 10 (–1/slope).
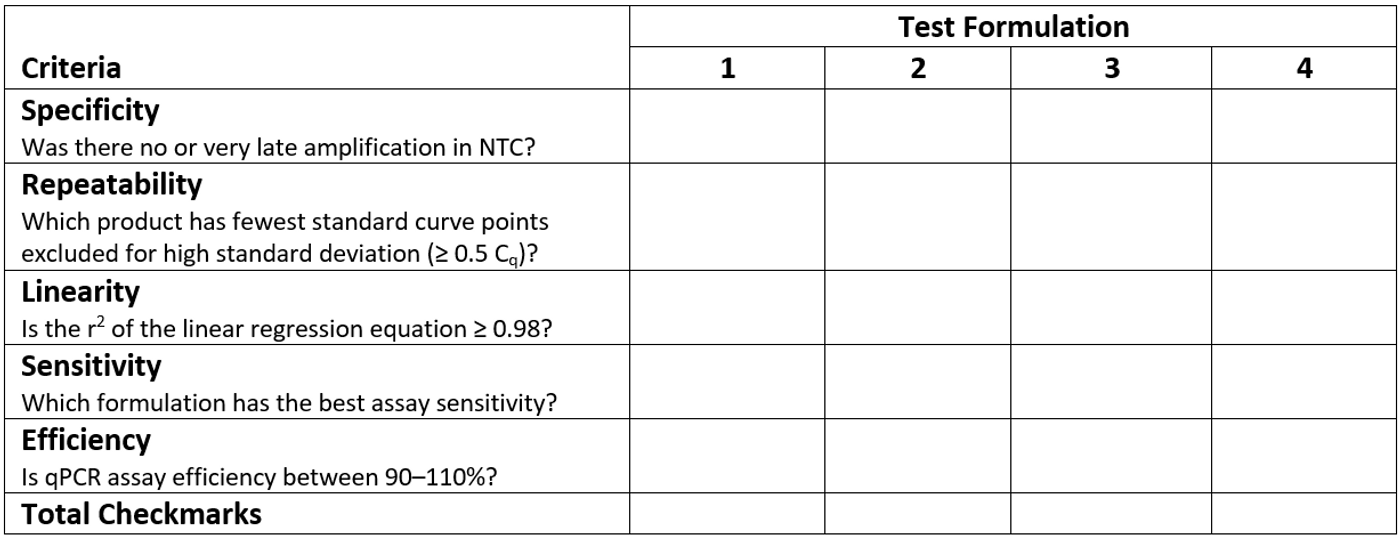
Tool for Comparing qPCR Reagent Formulations
This table is an example of a rubric for assessing qPCR assay performance. Place a check mark in the appropriate column corresponding to each qPCR reagent formulation tested. The qPCR formulation with the most checkmarks performs the best for your assay of interest.
Accelerate the optimization of your real-time qPCR assays by using the PCR Optimization Kit. The kit contains a portfolio of reaction buffers, MgCl2 and enzyme that help you quickly assess which combination of reagents will yield optimal PCR performance specific to your assay.
Authors: Sarah Teter, PhD, and Leta Steffen, PhD, Promega Corporation